Part I: Processing, error correction and diversity estimation
Clone the repository with datasets, MIGEC, MITCR and VDJtools executable JAR files and introduce aliases for running those JARs
export JAVA_OPTS="-Xmx8G" # set memory limit
MIGEC="java -jar ../migec-1.2.1b.jar"
MITCR="java -jar ../mitcr.jar"
VDJTOOLS="java -jar ../vdjtools-1.0.2.jar"
change dir to the folder with datasets
cd part1/
De-multiplex
The barcodes file is a tab-delimited file containing columns that correspond to sample ID, left and right barcode sequnece. Barcode sequence should contain a seed sub-sequence marked with upper-case bases, lower-case bases mark fuzzy match region, ambiguous nucleotides are allowed. Given multiplexed FASTQ files and file with sample barcodes one can run de-multiplexing as follows:
$MIGEC Checkout -ou barcodes.txt trb_R1.fastq.gz trb_R2.fastq.gz checkout/
Here -u option tells to extract UMI sequences marked with
capital N in the barcodes file.
The checkout/ directory will contain two pairs of FASTQ
files for corresponding samples and a log file with info on
de-multiplexing efficiency.
Check UMI statistics
Generate UMI coverage and error rate summary table
$MIGEC Histogram checkout/ histogram/
For plotting run the following auxiliary R script:
cd histogram/
wget https://raw.githubusercontent.com/mikessh/migec/master/util/histogram.R
Rscript histogram.R
cd ..
Note
Manual inspection reveals that there is good coverage peak separation (more than 5 reads per UMI) from low-coverage erroneous UMIs (peak at 1 read per UMI). Still there are some highly-amplified erroneous UMIs resulting from highly- covered true UMIs.
Assemble
Next, assemble all reads groups having the same UMI if the
group count is 5+ reads -m 5 and filter erroneous UMIs
with --filter-collisions. The --default-mask 0:1 option
tells to only assemble second read which is the one containing
CDR3 in current library prep setting (note that reads are oriented with
Checkout routine).
$MIGEC AssembleBatch --force-overseq 5 --force-collision-filter --default-mask 0:1 checkout/ histogram/ assemble/
The assemble/ folder now contains FASTQ files with assembled consensuses.
V-(D)-J mapping
The following code runs MIGEC/CdrBlast and MITCR software to map V, D and J segments, extract CDR3 sequences, assemble clonotypes and correct erroneous ones using various techniques.
# different quality thresholds
for q in 20 25 30 35; do
   $MIGEC CdrBlast -R TRB -q $q checkout/S2-1-beta_R2.fastq cdrblast/S2-1-beta.raw$q.txt
done
# second sample, Q35, for replica-based filtering
$MIGEC CdrBlast -R TRB -q 35 checkout/S2-2-beta_R2.fastq cdrblast/S2-2-beta.raw35.txt
# frequency-based error correction (mitcr)
$MITCR -pset flex checkout/S2-1-beta_R2.fastq cdrblast/S2-1-beta.mitcr.txt
# assembled data
$MIGEC CdrBlast -a -R TRB assemble/S2-1-beta_R2.t5.cf.fastq cdrblast/S2-1-beta.asm.txt
$MIGEC CdrBlast -a -R TRB assemble/S2-2-beta_R2.t5.cf.fastq cdrblast/S2-2-beta.asm.txt
The results are provided as tab-delimited clonotype abundance tables.
Take a glance at the data
Upload clonotype table(s) from cdrblast/ folder to vdjviz.milaboratory.com,
browse the clonotype tables, check for erroneous clonotypes by
performing a search for CDR3 amino acid sequence matching one of the
top clonotypes.
Final steps and report generation
MIGEC pipeline aims at running all steps from de-multiplexing to clonotype assembly and error correction for a batch of samples.
To continue with batch MIGEC analysis, run
# Process both raw and assembled data
$MIGEC CdrBlastBatch -R TRB checkout/ assemble/ cdrblast/
# Filter results from hot-spot PCR errors
$MIGEC FilterCdrBlastResultsBatch cdrblast/ cdrfinal/
The cdrfinal/ folder will contain filtered clonotype abundance tables.
Once all stages of batch MIGEC are complete, one can generate analysis report
with the following command:
$MIGEC Report .
Generated report will contain comprehensive statistics for all five stages of MIGEC analysis.
Note
Report generation uses R markdown and
parsing it to HTML requires installation of additional libraries. One can either
follow instructions on R markdown web page or install RStudio
that will in turn install all necessary packages.
If the report generation is unsuccessful, one can still use RStudio to
compile the report template (*.Rmd file that will be generated anyway) by
opening it and clicking “knit html” button.
Repertoire diversity analysis
First, convert samples into VDJtools input format
$VDJTOOLS Convert -S migec `ls cdrblast/S2-*-beta.raw*.txt` `ls cdrblast/S2-*-beta.asm.txt` convert/
$VDJTOOLS Convert -S mitcr cdrblast/S2-1-beta.mitcr.txt convert/
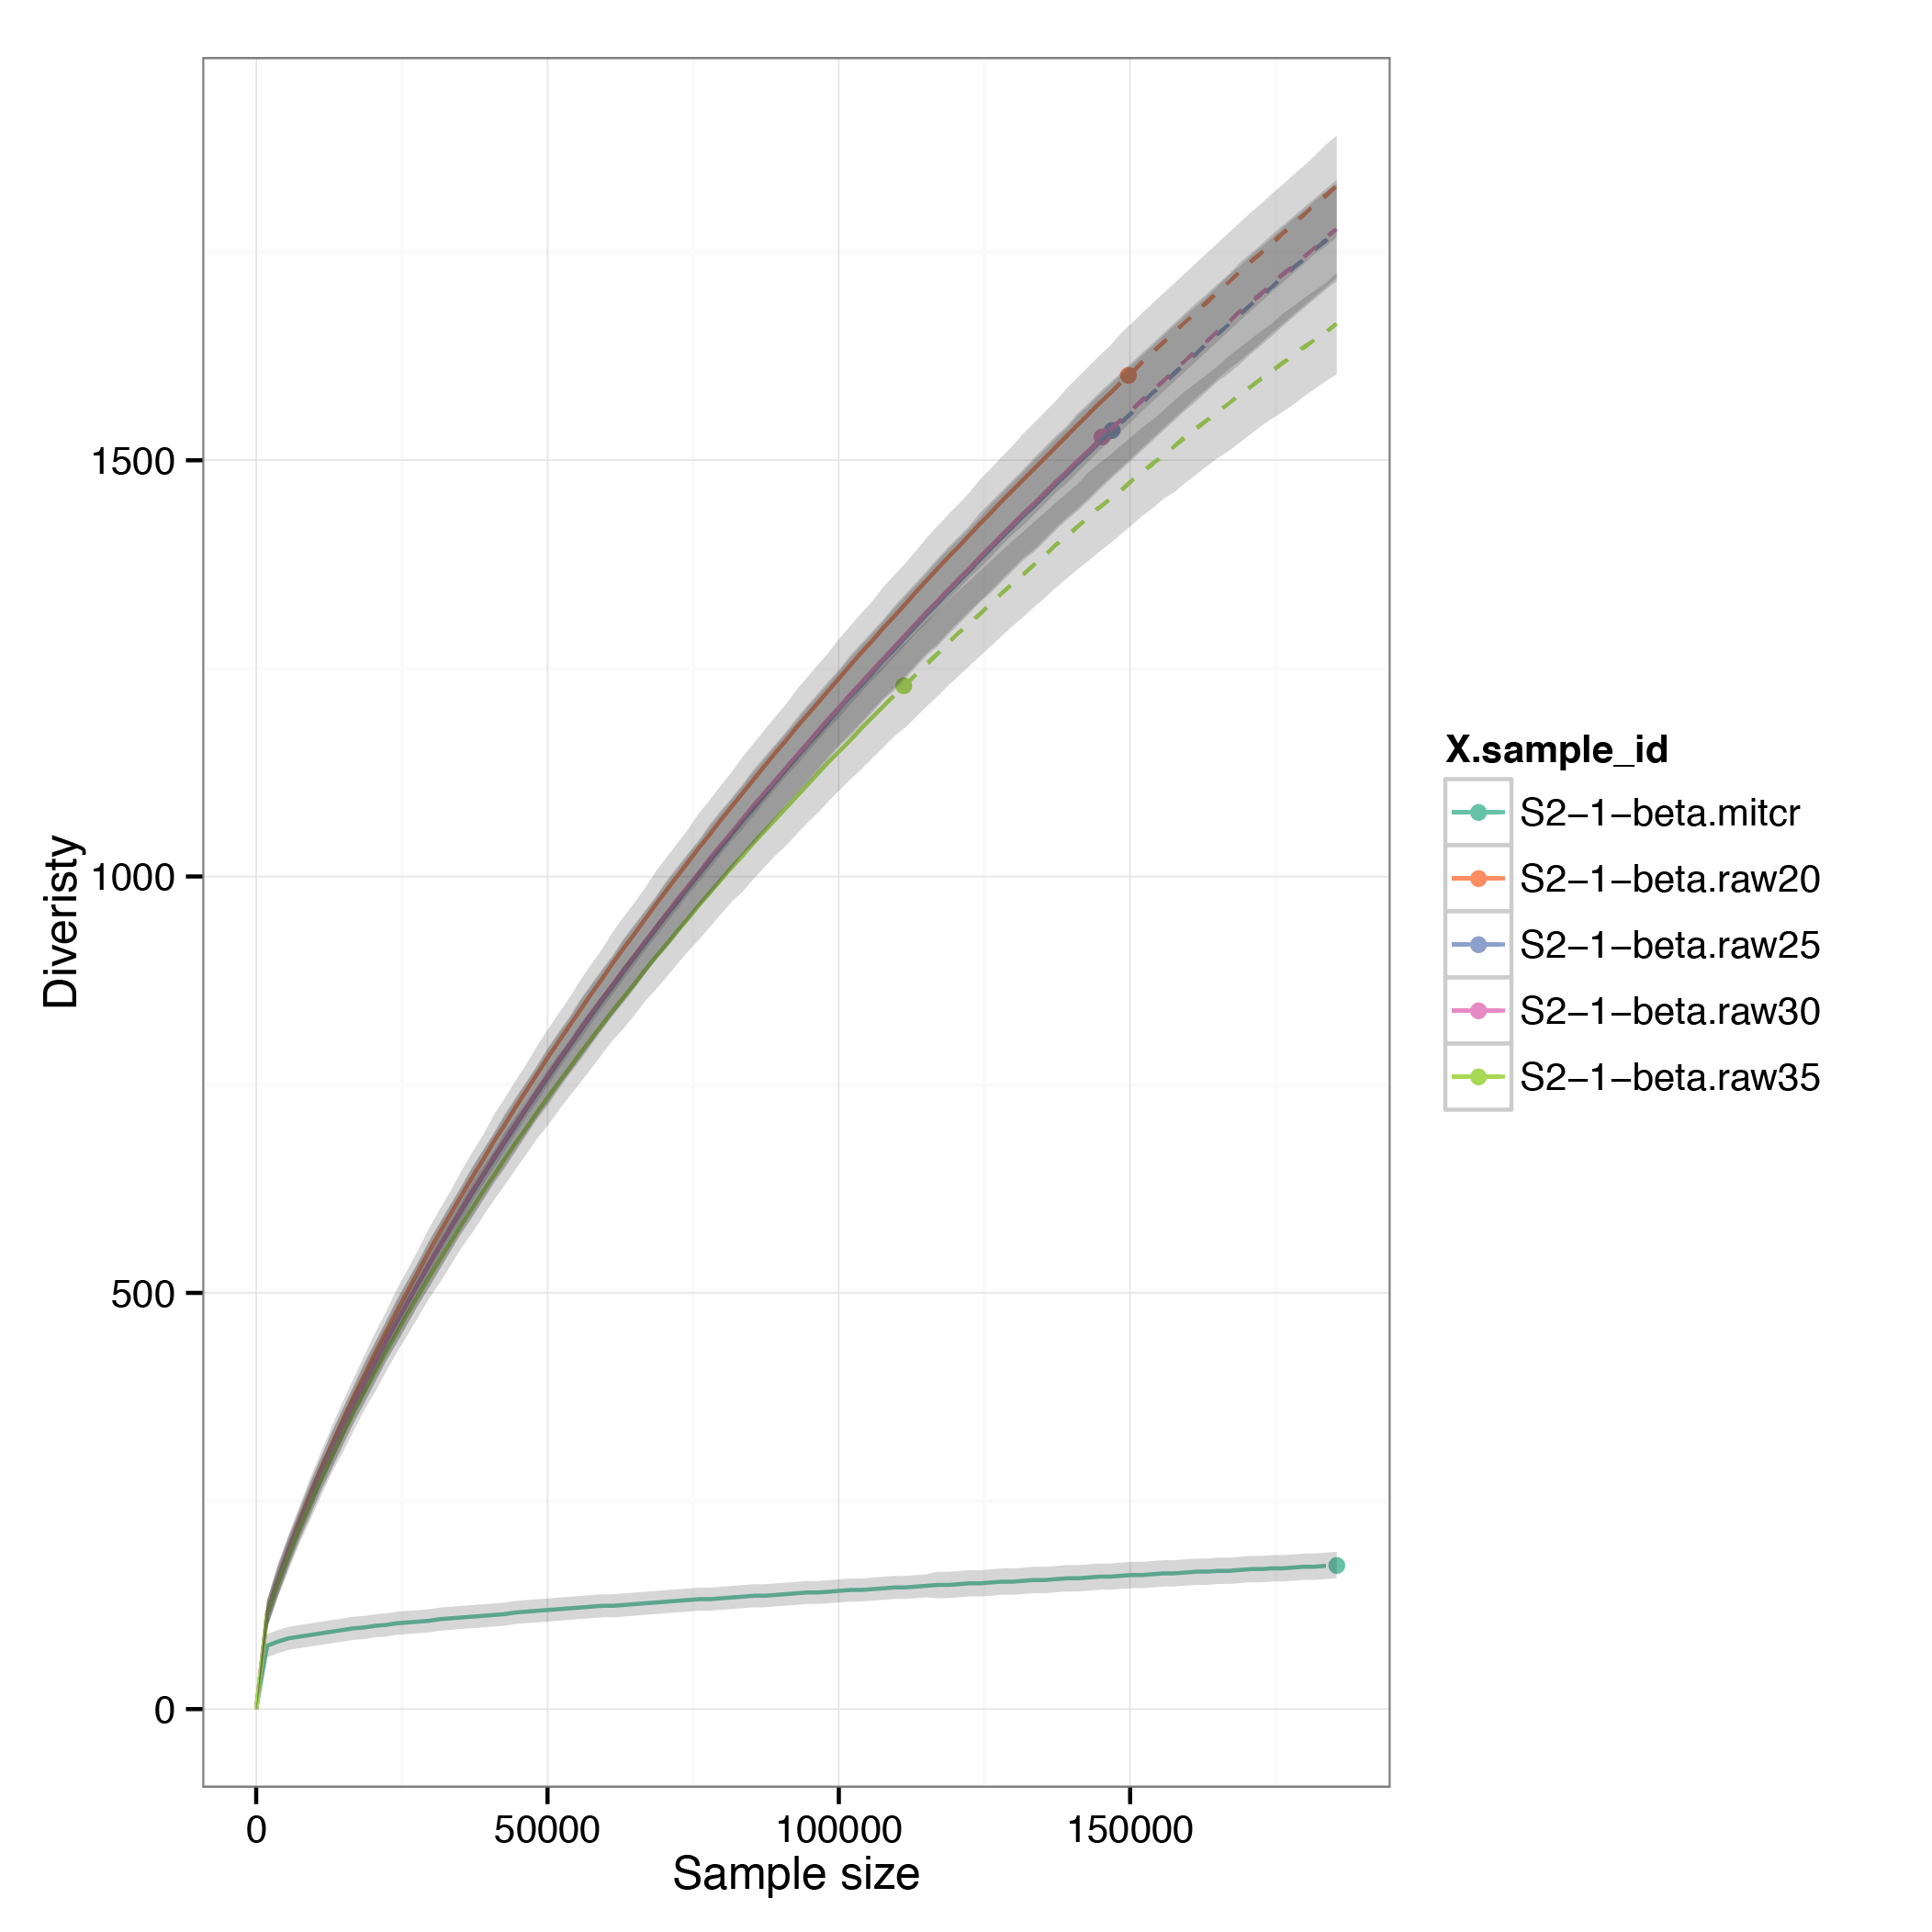
Next, compare rarefaction curves for quality-based filtering, frequency-based filtering and UMI-based assembly
$VDJTOOLS RarefactionPlot -f sample_id `ls convert/S2-1-beta.raw*.txt` convert/S2-1-beta.mitcr.txt rarefaction/qual-and-freq
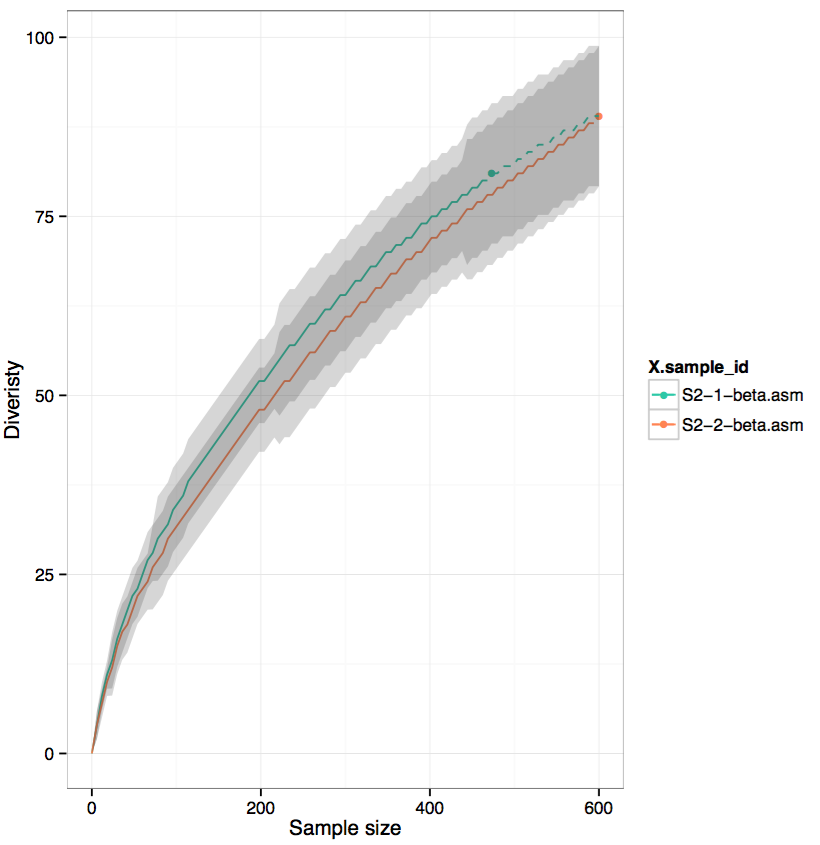
# plot curve for assembled data separately, as it uses #UMIs as count, not reads
$VDJTOOLS RarefactionPlot -f sample_id convert/S2-1-beta.asm.txt convert/S2-2-beta.asm.txt rarefaction/umi
Inspect pdf files in rarefaction/ folder.
Note
Note that as only 1000 cells were sequenced, and the protocol efficiency is ~0.5 reactions per cell, therefore at most 500 clonotypes can be expected. The number of observed clonotypes in raw data is substantially higer,UMI-assembled data, on the other hand is in good agreement with our expectations.
Using replicates
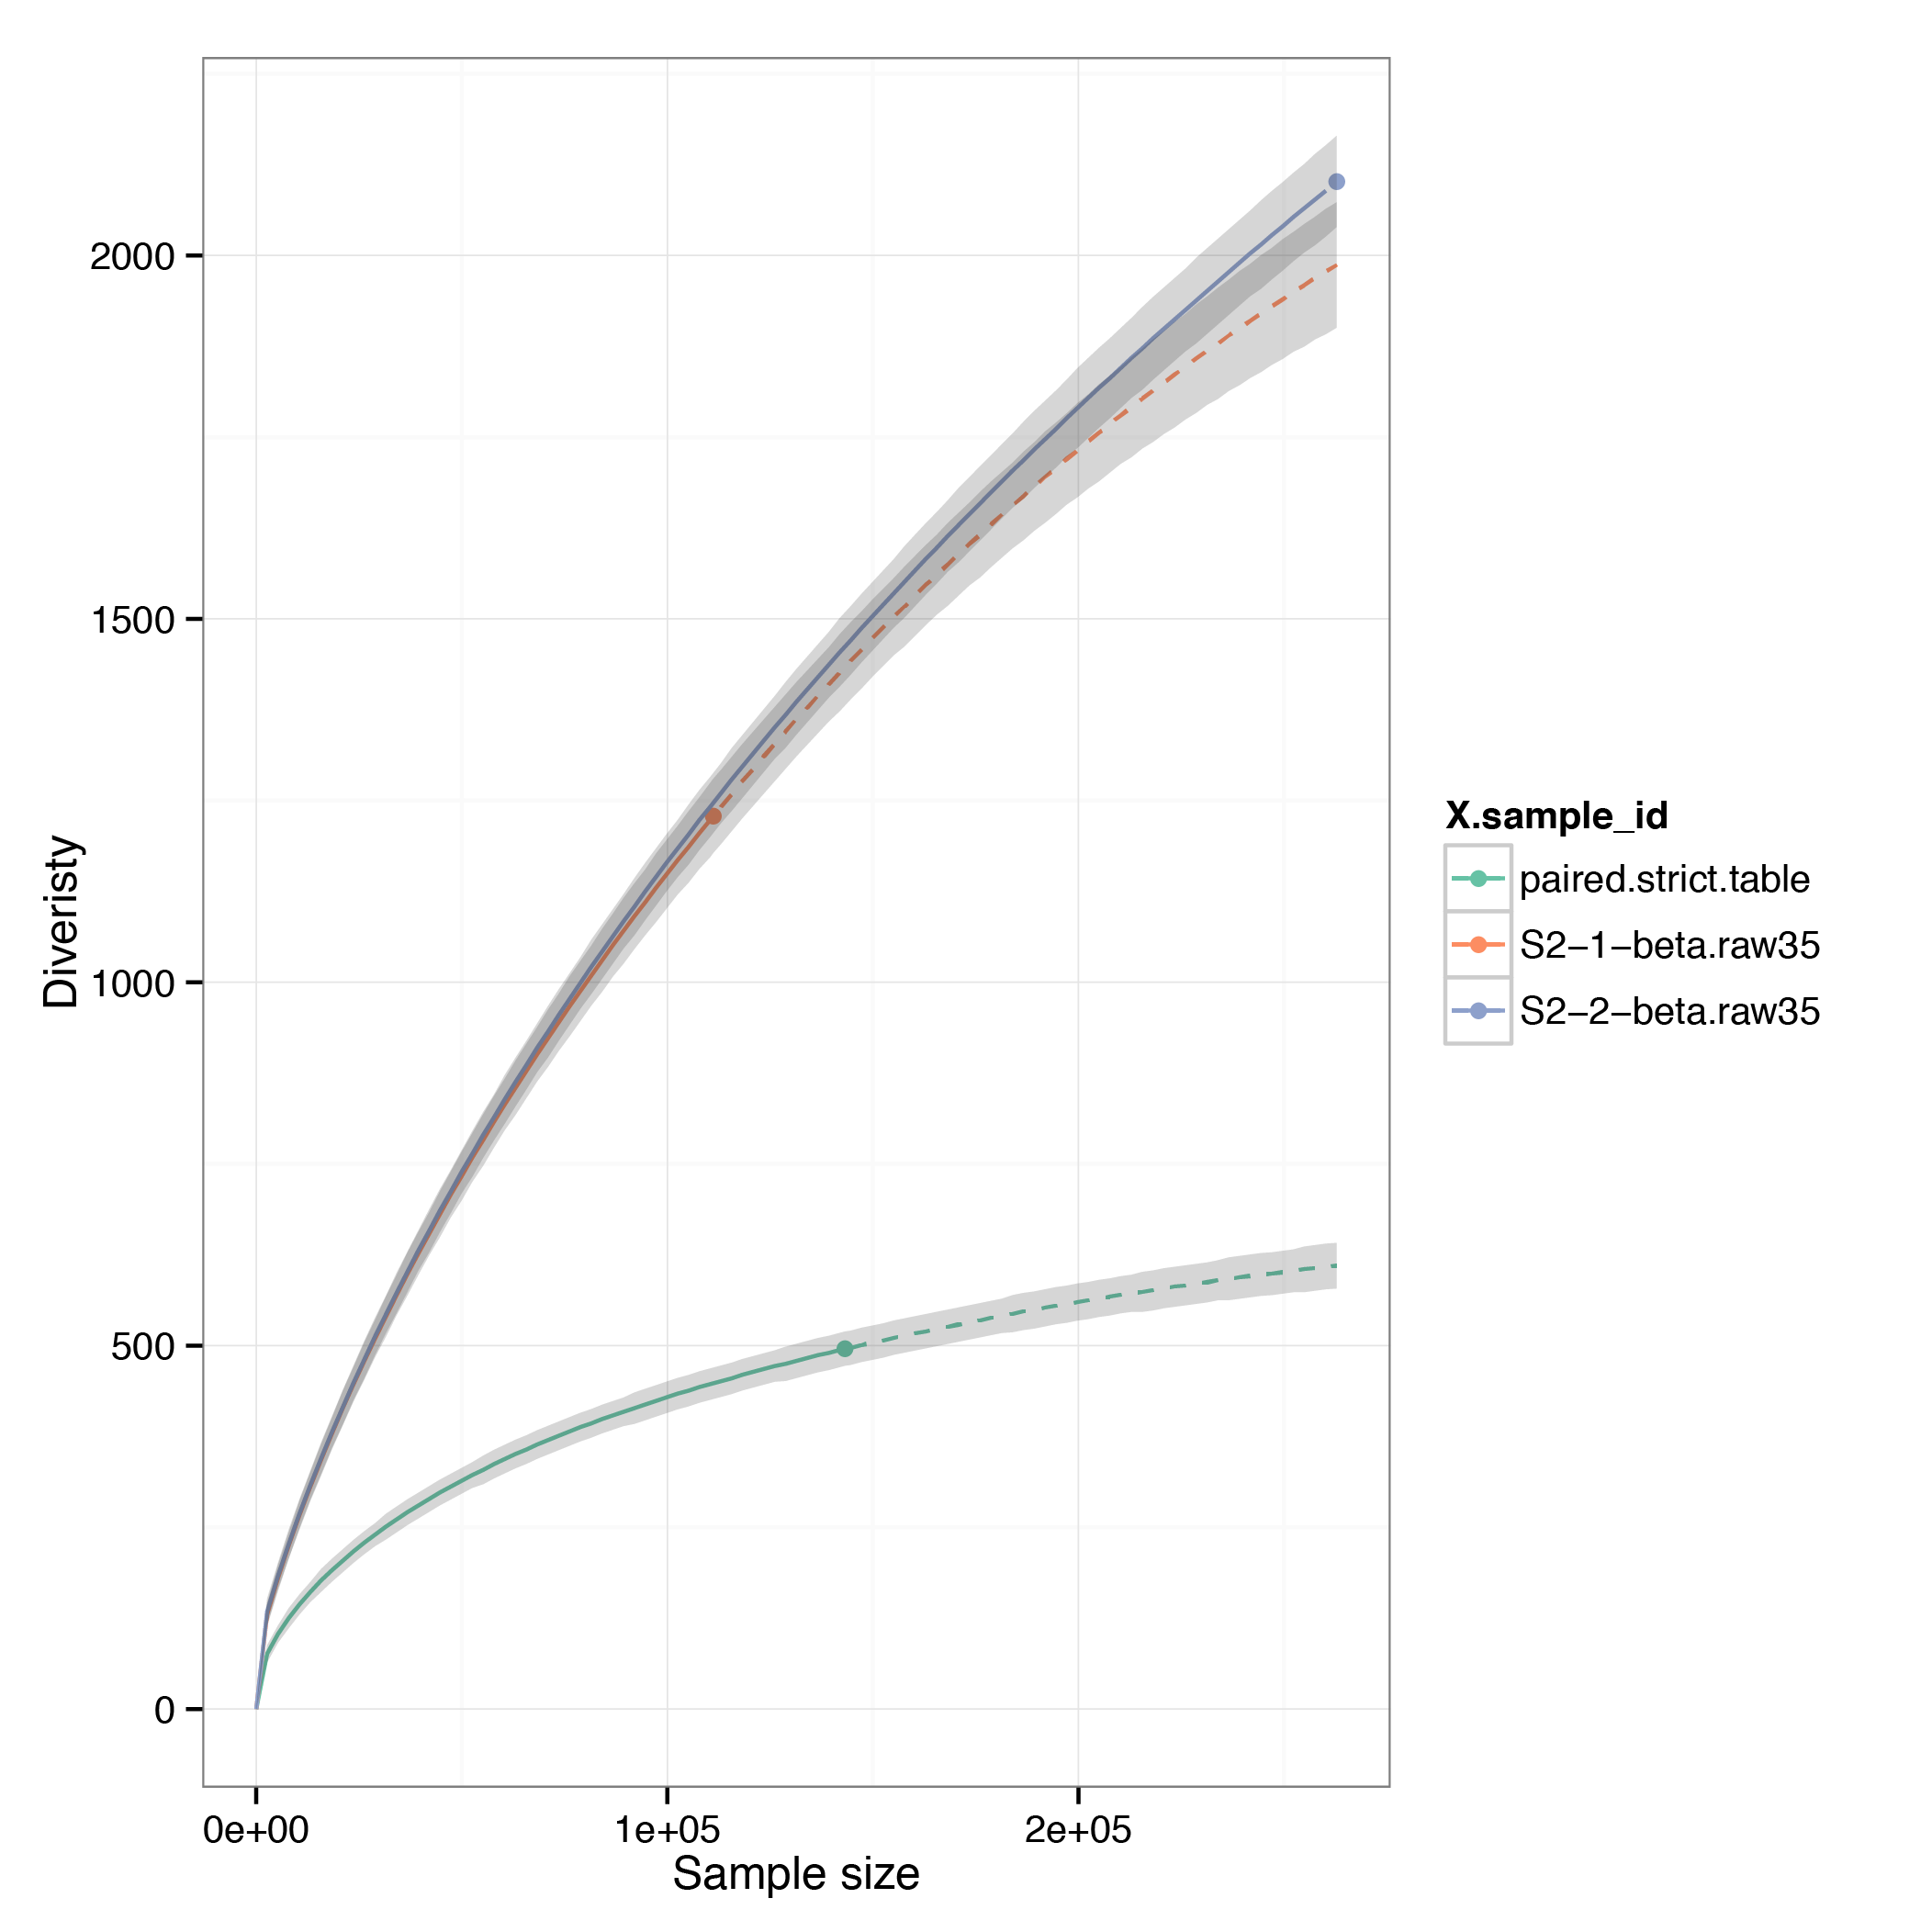
Overlap clonotype tables for two Q35-filtered raw datasets coming from different samples and compare rarefaction curves
$VDJTOOLS OverlapPair convert/S2-1-beta.raw35.txt convert/S2-2-beta.raw35.txt convert/
$VDJTOOLS RarefactionPlot -f sample_id convert/S2-1-beta.raw35.txt convert/S2-2-beta.raw35.txt convert/paired.strict.table.txt rarefaction/overlap
Note
There is still a substantial level of artificial diversity, suggesting that the errors in CDR3 sequence are recurrent. So replicates are not very useful to correct diversity estimates.