Part II: Comparing diversity estimation methods
Datasets to be analyzed in this section can be found
in task2/ folder. There are 39 preprocessed clonotype
tables for TRB repertoires of healthy donors of
various ages. This folder also contains metadata.txt
file with the age and percent of naive T-cells for each
donor.
Estimating diversity
Corresponding routine of VDJtools framework is called CalcDiversityStats. The list of diversity estimates that can be computed using this routine is given here
$VDJTOOLS CalcDiversityStats -m metadata.txt .
This will generate two files with diversity estimates, suffixed
as .exact.txt and .resampled.txt. The latter contains estimates
computed on datasets down-sampled to the size of the smallest one.
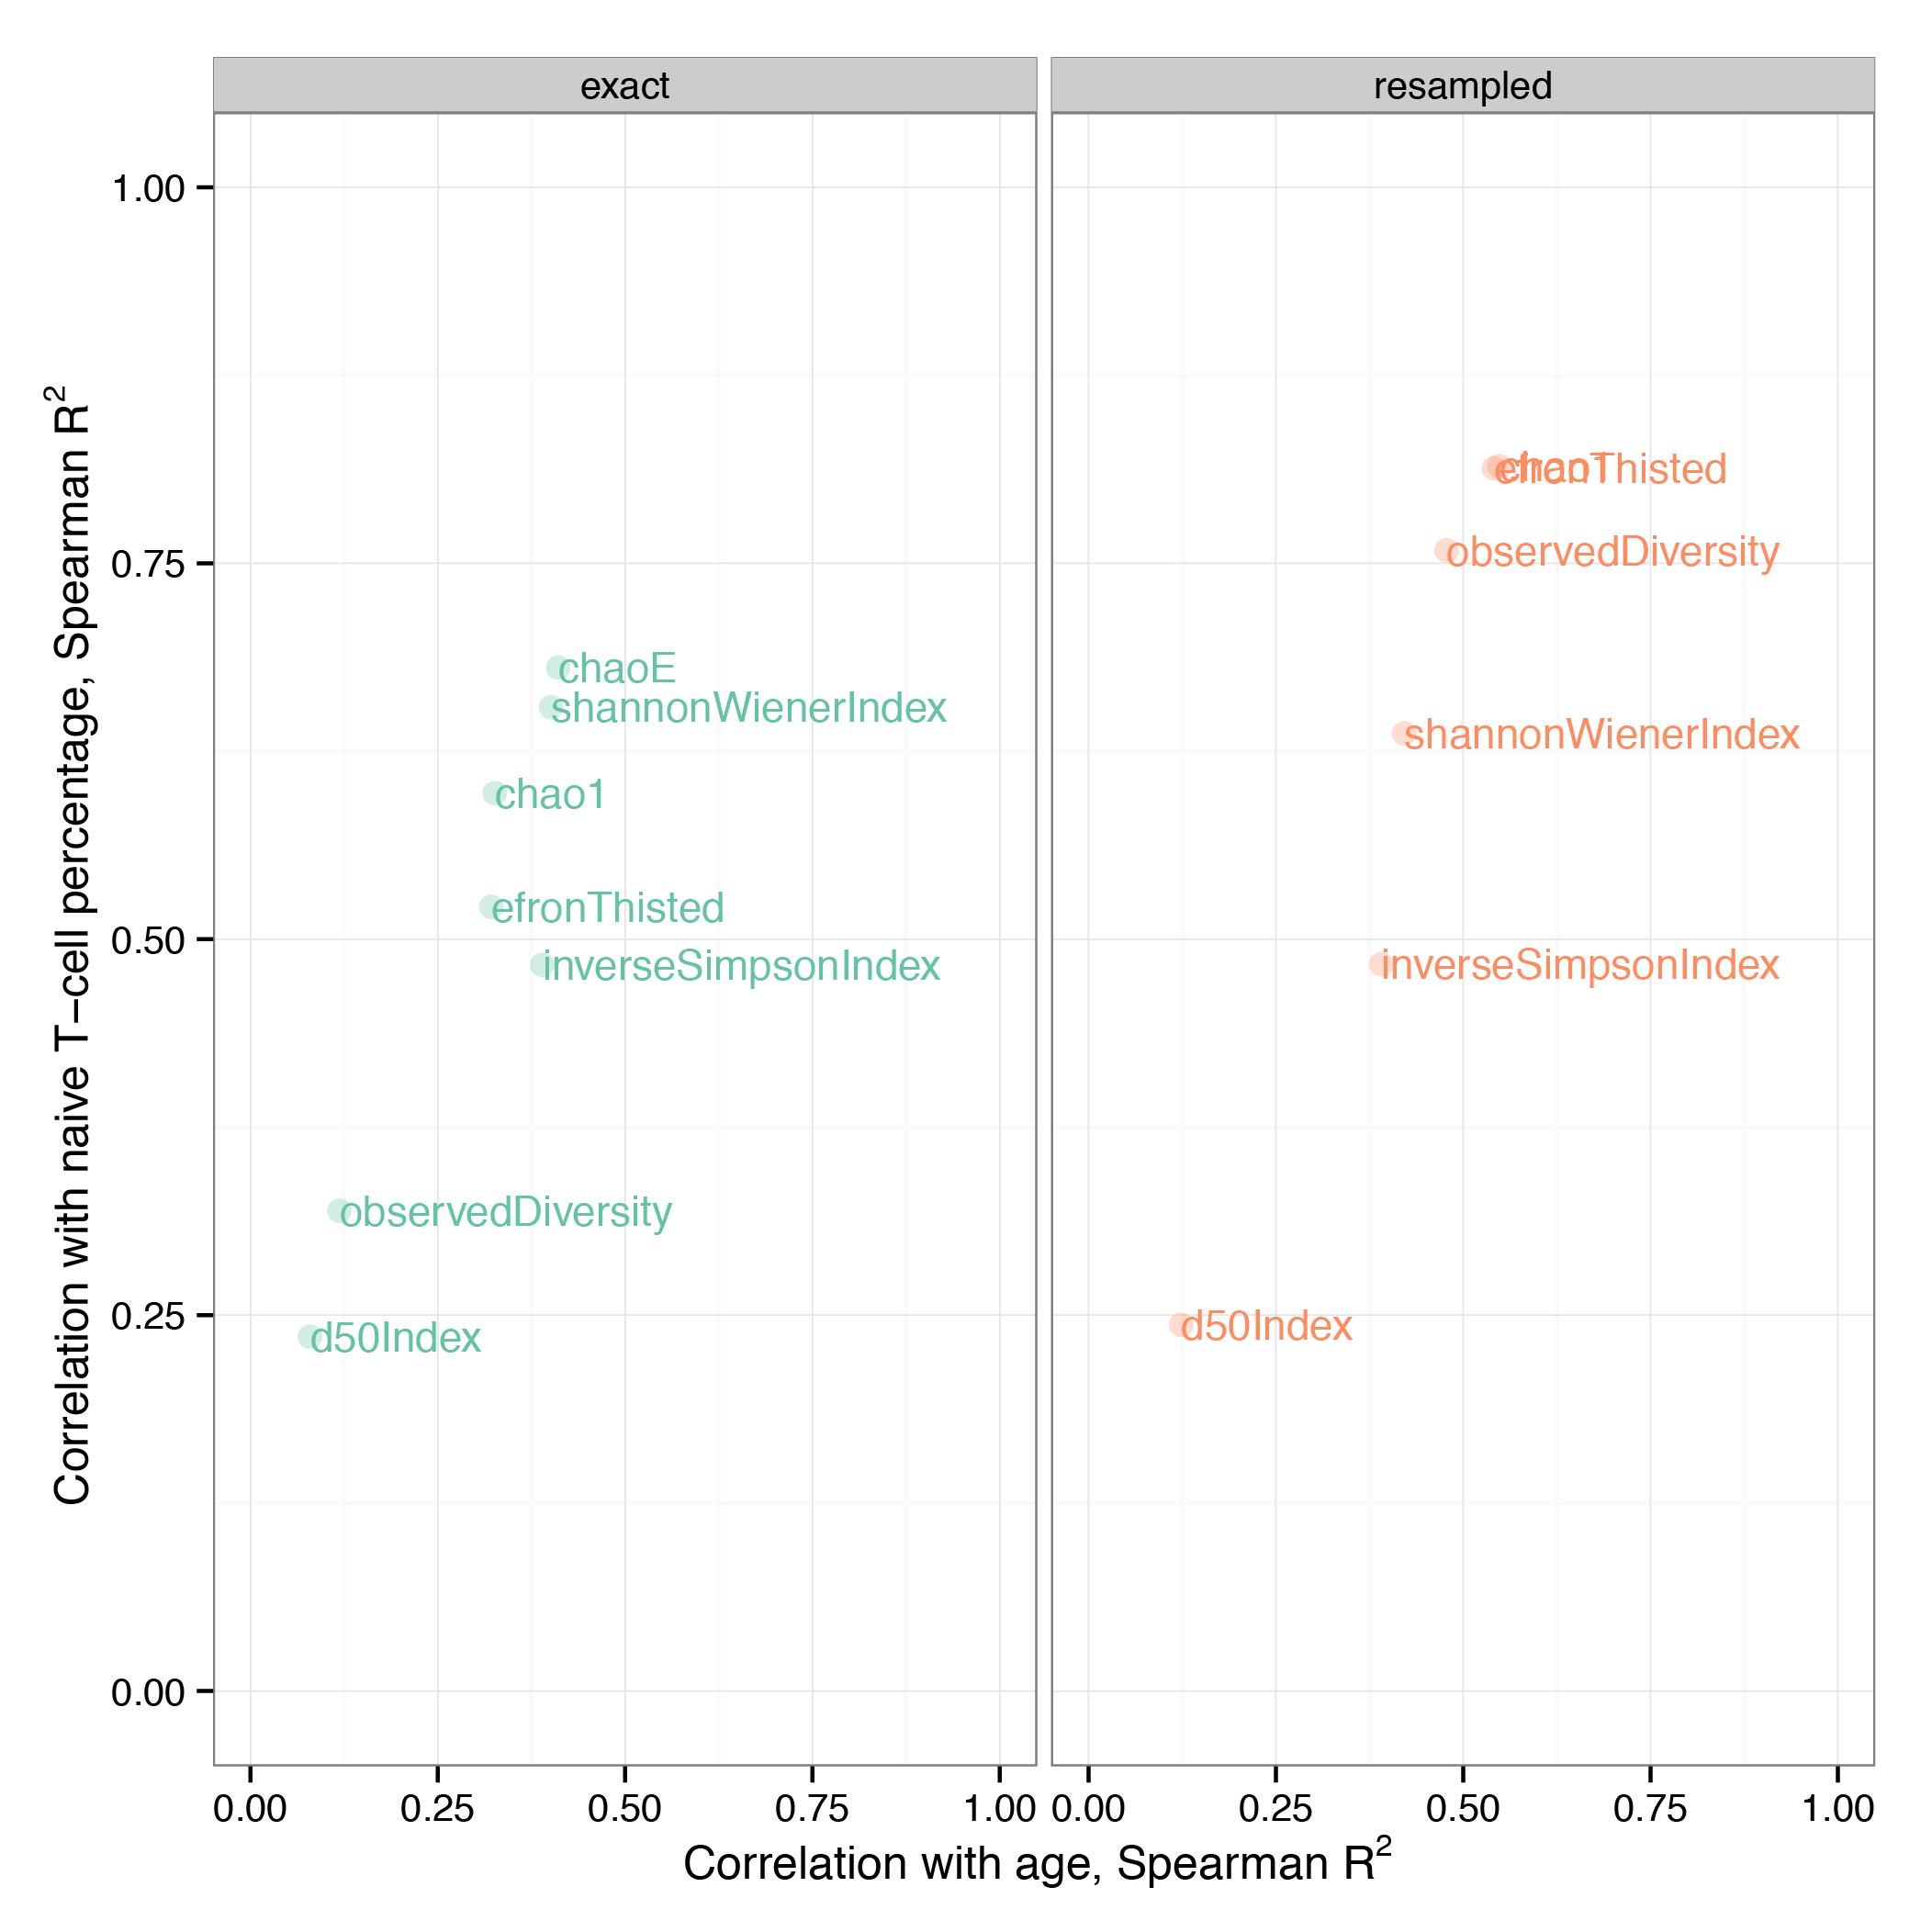
Plotting and comparing
The following R script will generate two plots comparing the performance of various diversity estimates computed for original and resampled data. The comparison is performed based on Spearman correlation
require(ggplot2)

# load data tables
df.e <- read.table("diversity.strict.exact.txt", header=T, comment="", sep="\t")
df.r <- read.table("diversity.strict.resampled.txt", header=T, comment="", sep="\t")

# prepare a table to store correlation coefficients
measures <- c("observedDiversity", "chaoE", "efronThisted", "chao1", "d50Index", "shannonWienerIndex", "inverseSimpsonIndex")
methods <- c("exact", "resampled")

g <- as.data.frame(expand.grid(measures, methods))
colnames(g) <- c("measure", "method")
g[, "age"] <- numeric(nrow(g))
g[, "naive"] <- numeric(nrow(g))

# fill table
for (i in 1:nrow(g)) {
  measure <- as.character(g[i,1])
  method <- as.character(g[i,2])

  if (method == "exact") {
    df <- df.e
  } else {
    df <- df.r
  }

  y <- as.numeric(as.character(df[,paste(measure, "mean", sep="_")]))

  x <- as.numeric(as.character(df[,"age"]))
  g[i, 3] <- cor(x, y, method="spearman") ^ 2
  x <- as.numeric(as.character(df[,"naive"]))
  g[i, 4] <- cor(x, y, method="spearman") ^ 2
}

# plot results
pdf("measure_comparison.pdf")
ggplot(g, aes(x=age, y=naive, color=method, label=measure)) +
  geom_point(size=3, alpha=0.3) + geom_text(cex=4, hjust=0) +
  scale_x_continuous(name = bquote('Correlation with age, Spearman '*R^2*' '), limits=c(0,1)) +
  scale_y_continuous(name = bquote('Correlation with naive T-cell percentage, Spearman '*R^2*' '), limits=c(0,1)) +
  scale_color_brewer(palette="Set2") +
  facet_grid(~method) +
  theme_bw()+theme(legend.position="none")
dev.off()
Warning
Headers in VDJtools output are marked with #, so we need to specify comment=""
when loading the data table in R.
Note
We use Spearman correlation coefficient, as the distribution for some measures like lower bound total diversity estimates is highly skewed.
Expected results